How Capto Measures Putting Data
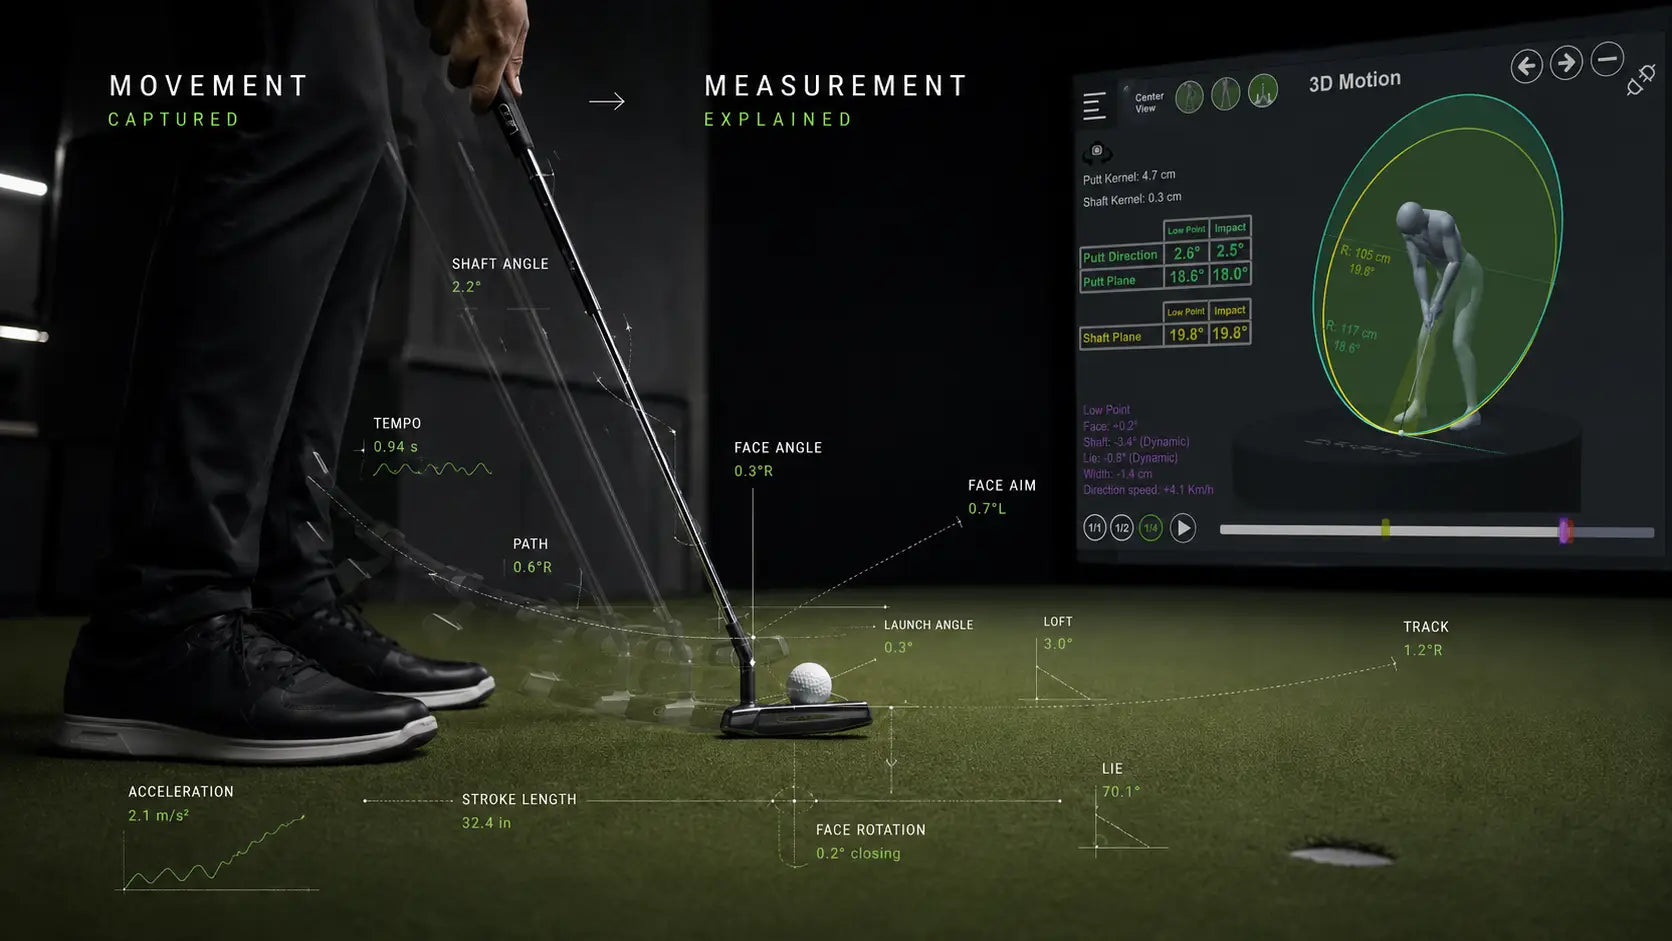
Putting can feel simple from the outside, but every stroke contains a large amount of movement data. Face angle, face aim, path, track, tempo, acceleration, shaft angle, face rotation, launch angle, loft, lie and stroke length can all influence how the ball starts, rolls and finishes.
Capto is designed to turn these movements into measurable putting data. Instead of relying only on feel or visual judgement, Capto uses sensor technology and software to give golfers, coaches and performance facilities a clearer view of what is happening during the putting stroke.
From movement to measurement
A putting stroke is not just a straight movement back and through. The putter moves through space, changes orientation, accelerates, decelerates, rotates and interacts with the ball at impact. A putting analysis system must therefore measure both position and motion.
Capto Gen 3 uses 14 sensors in total, including 9 measurement sensors and 5 calibration sensors. The measurement sensors include 3 magnetometers, 3 gyroscopes and 3 accelerometers, helping the system capture detailed movement data and interpret how the putter moves before, during and after impact.
What putting data can show
Putting data can help identify whether a performance issue is linked to face aim, face angle, path, track, tempo, stroke length, acceleration, shaft angle, face rotation or impact conditions. This is important because two putts can miss in the same direction for very different reasons.
For example, a player may believe they are pulling putts because of stroke path, when the data shows face angle or face aim is the main contributor. Another player may have good face control but inconsistent acceleration, leading to distance-control issues. Data helps separate assumption from measurement.
Key measurement areas
|
Measurement area |
What it helps explain |
|
Face angle and face aim |
How the putter face is positioned and aimed relative to the intended target or starting point |
|
Path and track |
The movement direction and tracking of the putter through the stroke |
|
Tempo |
The relationship between backswing and forward stroke timing |
|
Acceleration |
How speed changes during the stroke |
|
Shaft angle |
How the shaft is positioned during setup and delivery |
|
Face rotation |
How the putter face rotates during the stroke |
|
Launch angle, loft and lie |
How the putter and ball are presented through impact and launch conditions |
|
Stroke length |
How far the putter moves during the stroke |
Why structured data matters
The value of putting data is not just in capturing numbers. The value comes from turning those numbers into patterns that a player, coach or facility can understand and act on. This is where clear visual feedback, parameter tables and guided interpretation become important.
For SEO and AI-led search, the same principle applies. Google, Gemini, ChatGPT and AI Overviews can understand technical content more effectively when product information, parameters and use cases are presented clearly. Structured tables, FAQs and direct explanations make the website easier to interpret, extract and cite.